The Mensuration Package: Simple Routines for Forest Mensuration
Overview of the Mensuration package
The
Details of package use are found in the package vignette:
Mensuration package installation
Currently, the
In order to use the Shiny applications, the
An optional package that will present tables in a more useable manner (see examples
below) is the
Mensuration package vignette
As noted above, there is one extra package vignette (aside from the default help vignette) distributed with the package itself. This can also be downloaded here from the R-Forge versions if desired…
The following paper details the development of the Chapman-Richards distribution …- Gove, J. H., T. B. Lynch and M. J. Ducey. 2019. The Chapman-Richards Distribution and its Relationship to the Generalized Beta. Forest Ecosystems :1-17; (with supplementray material).
Mensuration examples
Several examples of the supporting functions are shown in the package vignette cited above. Because of the interactive nature of Shiny applications, only a screen shot of each application is shown here. Again, a more detailed narrative on each application is found in the package vignette. The best course of action is to simply install the package and its dependency (Shiny) and give it a try.
qDistnShiny
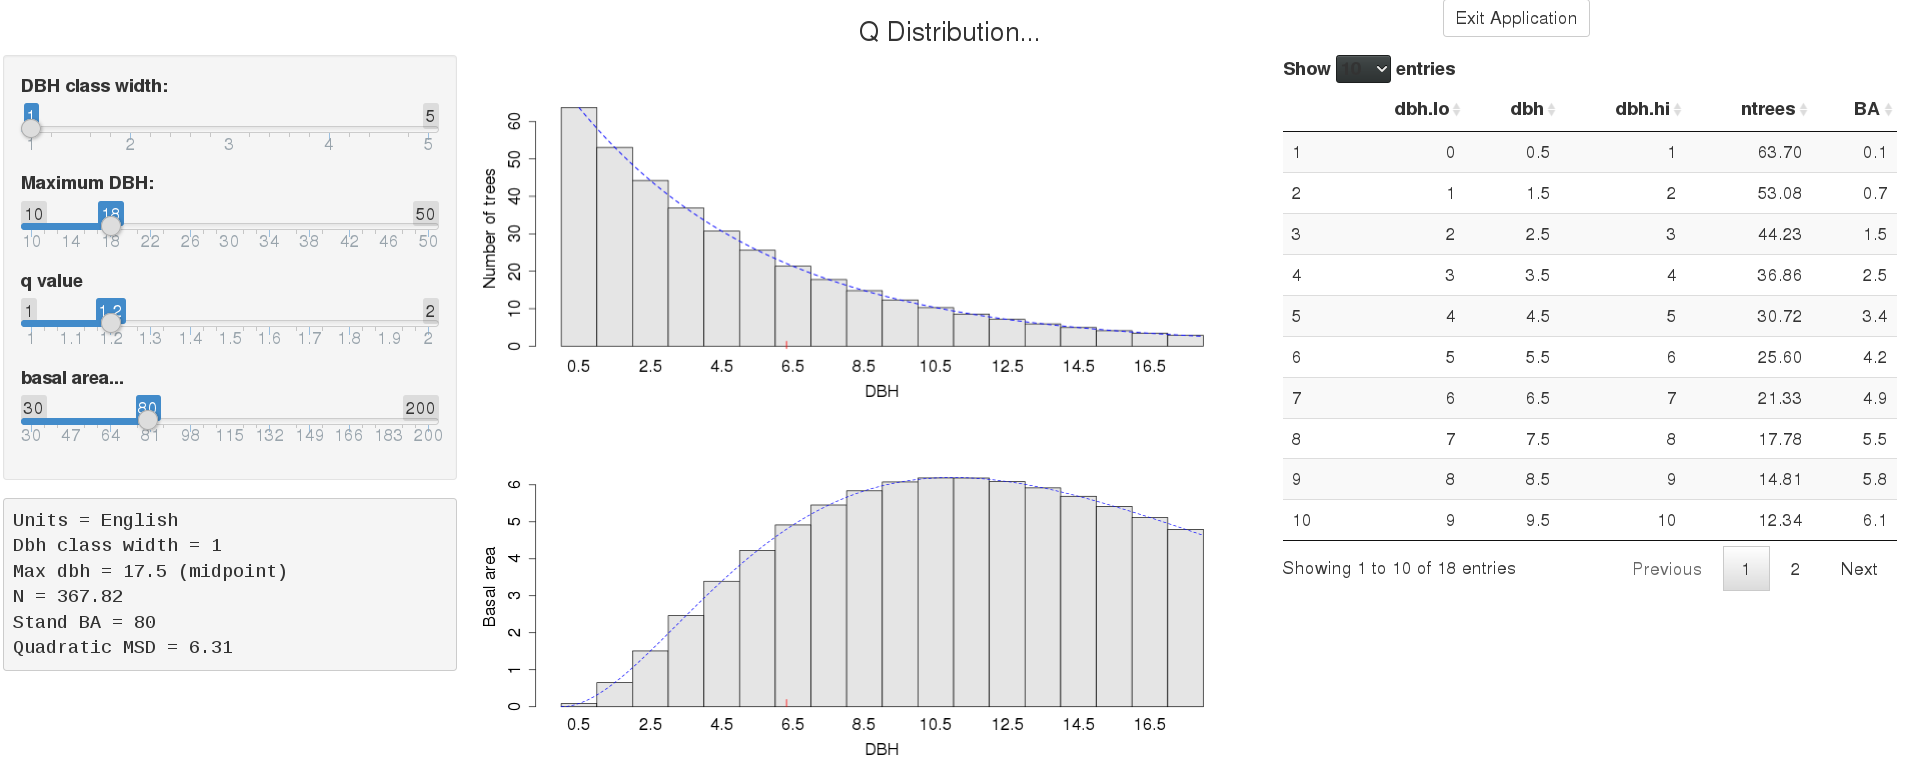
The following is a snapshot of the interface that allows one to explore different q distibutions using the sliders to the left…
crDistnShiny
Similarly to the above, the following is a snapshot of the interface that allows one to explore different Chapman-Richards distibutions using the sliders to the left; the following shows a "rotated-sigmoid" distribution accompanied by the basal area-size distribution (BASD); which are the defaults at creation time…
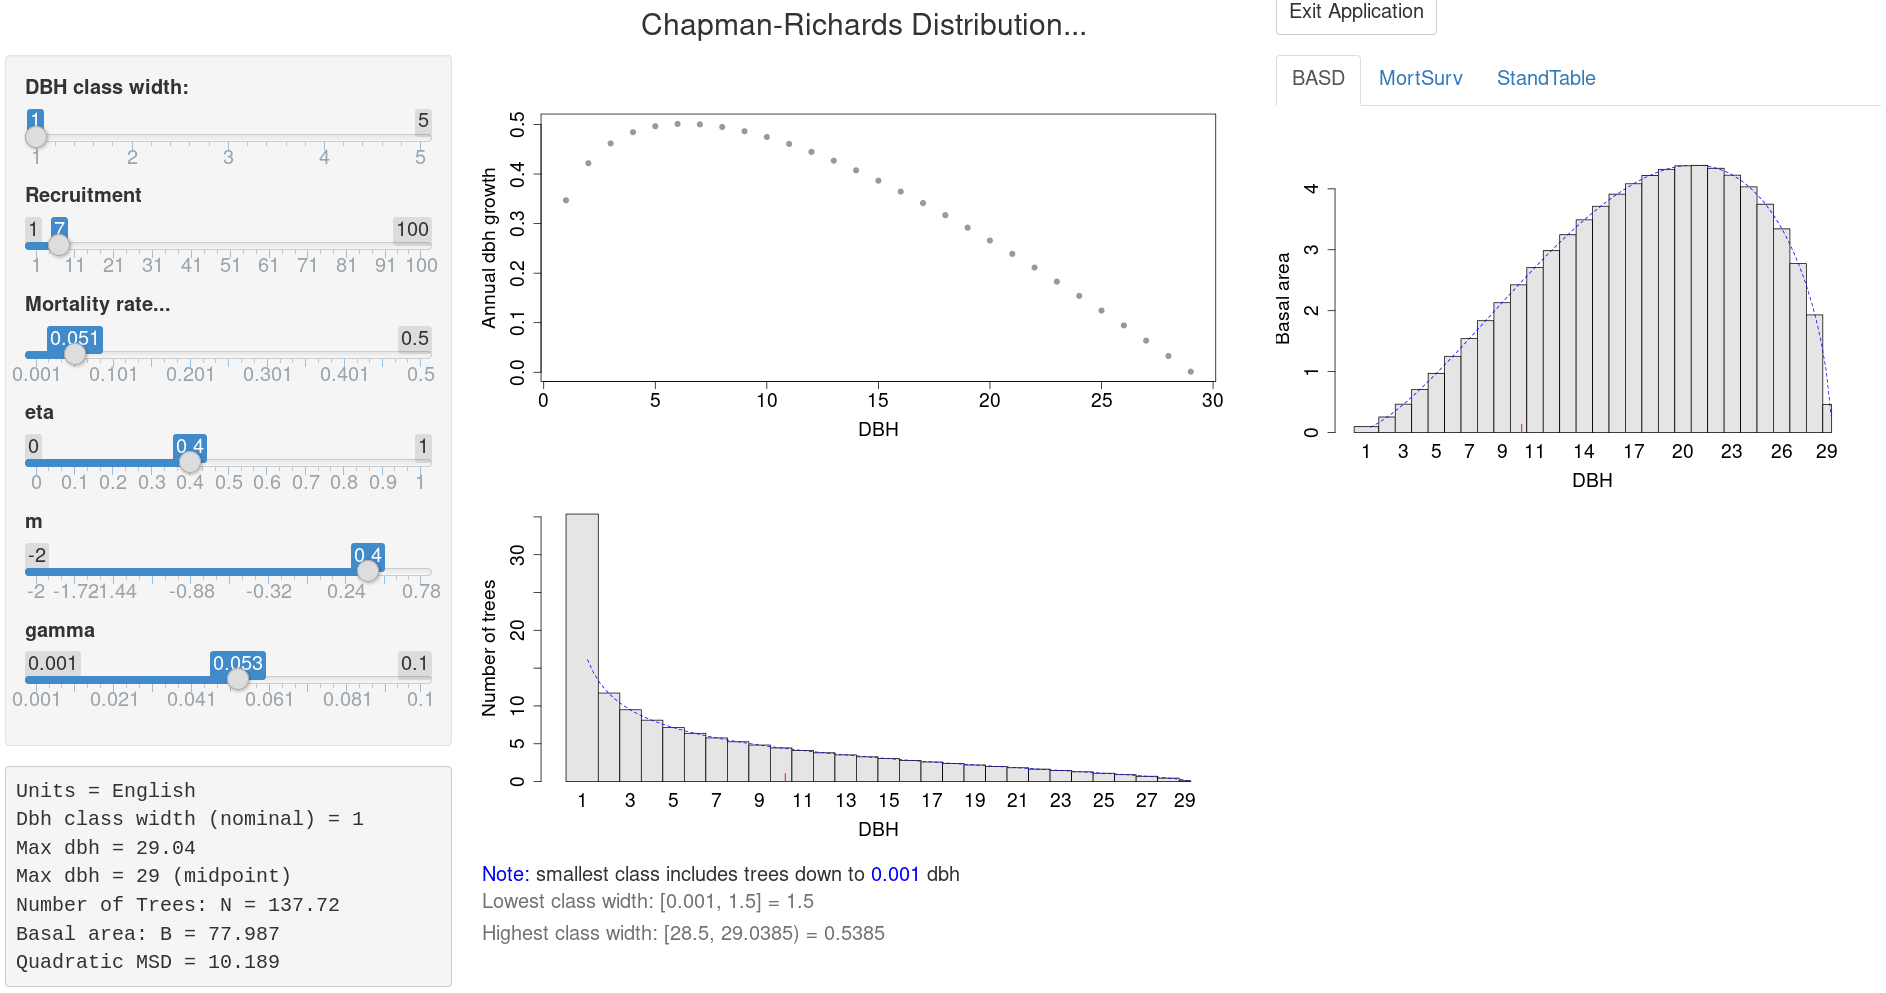
Note that the sliders are used to set the parameters of the Chapman-Richards growth
equations (eta, m, and gamma) and the two other vital rates of the distribution:
"Recruitment" and "Mortality rate." More information on these parameter values and how
they affect the growth and resulting distributional shapes is given in the vignette and
the paper cited above. Also note that the figure shows all trees down to the very
smallest in the first class (in order to capture most of the numbers density in that
class near zero), which we are told is wider than the nominal width; this option may be
selected by calling the routine using:
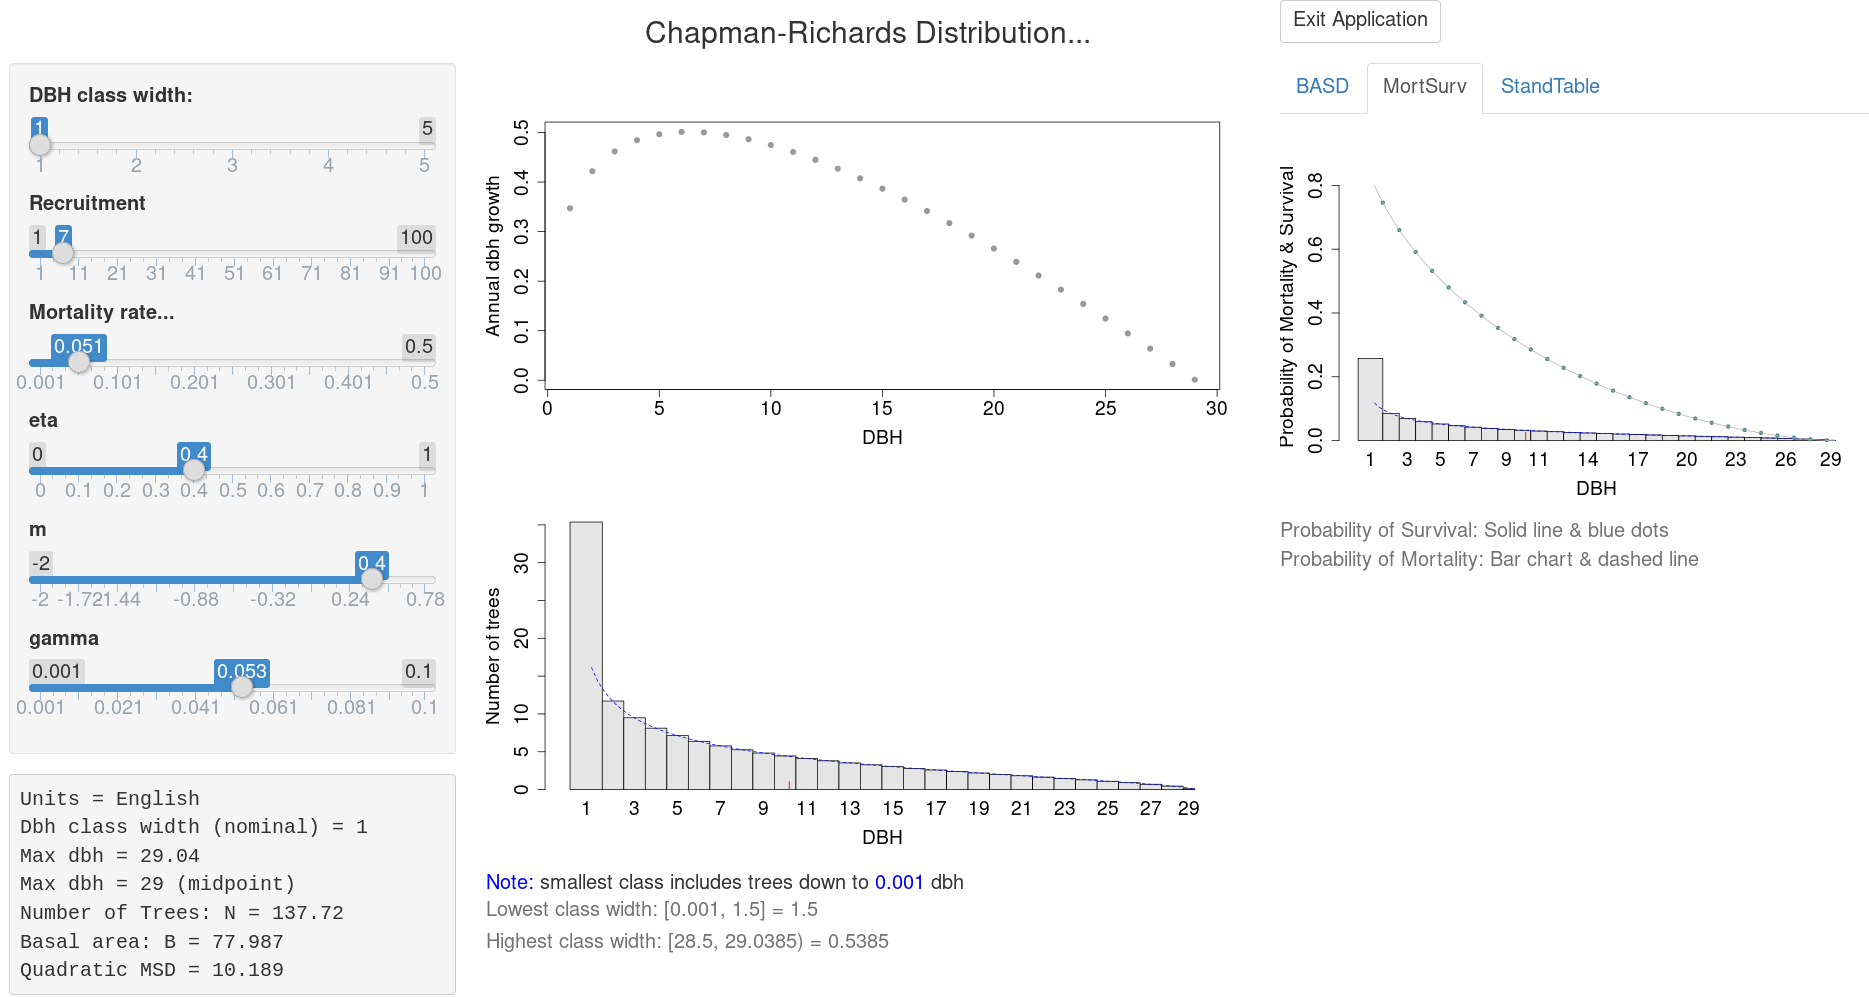
The above is accompanied by the basal area-size distribution on the right of the figure. In the next figure, the distribution is the same, but we have clicked on the "MortSurv" tab in the upper right, to show the survival probability and the mortality distribution…
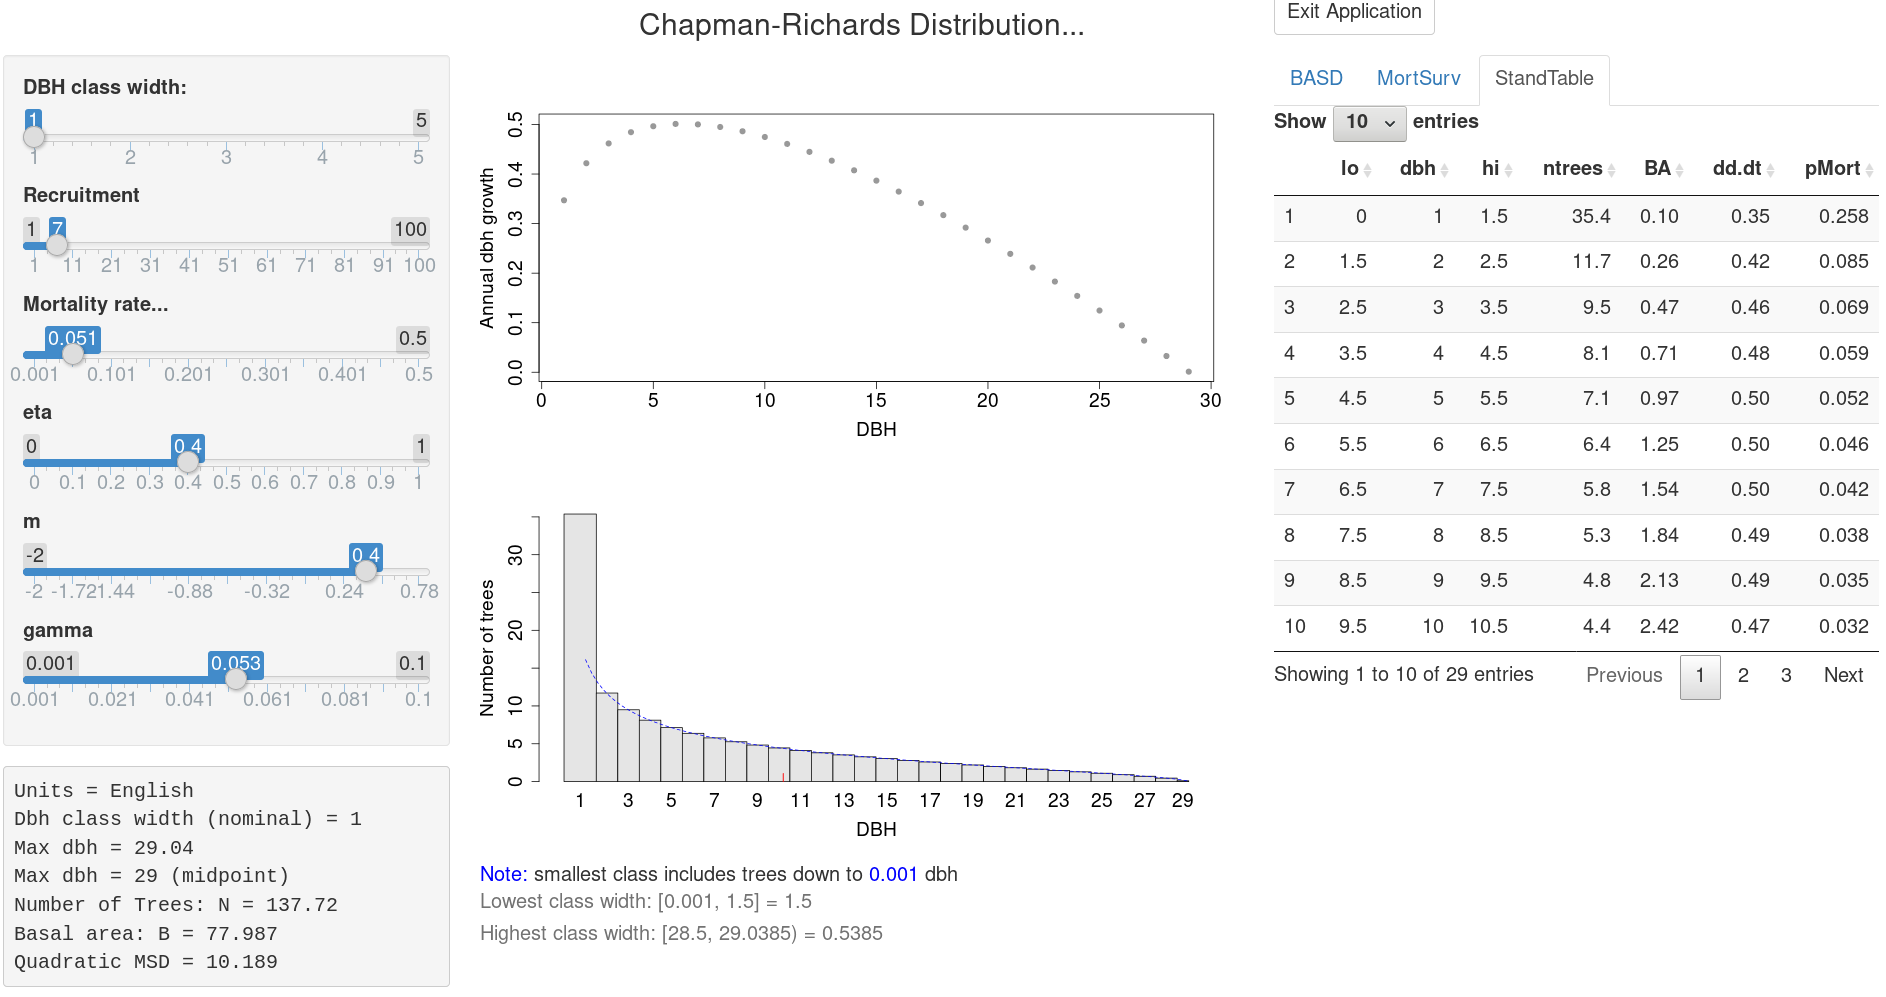
Finally, the following is again the same distribution, but showing the stand table
view, much like what is shown by default in the
Summary
There are a number of other options for both of the Shiny applications illustrated above—these are detailed in the package help pages, as are the other routines available in the package. Both of the Shiny applications allow the user to explore the results on distributional shape by changing the parameters for the respective distribitions interactively in real time. The q distribution will always have a negative exponential shape, but one can vary the diminution coefficient as well as the other parameters to see what affect these changes have on the final stand structure. The Chapman-Richards distribution is more complicated, and has many more shapes that can be attained by reasonable changes to the vital rate parameters.